
Adobe Commerce B2B Features: What Magento Gives You Natively, and Where Custom Work Starts

Category
Digital Marketing

If you are an eCommerce business owner, you know that having an online store doesn’t guarantee success. You need to measure your store’s performance to ensure you are moving in the right direction. For the same, you need eCommerce KPIs.
On the other hand, whether you are a manager, marketer, analyst, or consultant, you already know that tracking key performance indicators is essential to analyze & optimize the eCommerce store’s performance.
KPIs allow you to track the progress of your business goals and objectives, identify areas for improvement, and make data-driven decisions that drive growth and success. However, with so many KPIs available, deciding which ones to focus on and how to use them effectively can be challenging.
In this blog, we have researched & curated the best eCommerce KPIs that help you measure your eCommerce store’s performance.
So, whether you are starting in eCommerce or want to optimize existing operations, we provide valuable insights and help you improve your eCommerce performance via effective KPI tracking and analysis.
But, before that, we will look at some basics of eCommerce KPIs.
What are eCommerce KPIs?
eCommerce KPIs (Key Performance Indicators) are measurable metrics used to evaluate the performance of an eCommerce business. These metrics help eCommerce businesses track progress towards their goals and objectives and identify areas where improvements are necessary.
How Does Tracking eCommerce KPIs Help Your Business?
There are several ways through which tracking KPIs can help your eCommerce business. They are as follows.
- Identify Areas For Improvement: By tracking KPIs such as conversion rate & cart abandonment rate, you can determine where your eCommerce business needs improvement.
- Measure Progress Towards Goals: eCommerce KPIs help you track progress towards your business goals & objectives.
- Make Data-Driven Decisions: Monitoring eCommerce KPIs offers you actionable data that you can use to make informed decisions about your business.
- Optimize Your Operations: By tracking KPIs like AOV and CLV, you can optimize operations, especially when combined with the best eCommerce integrations for seamless data analysis.
15 Best eCommerce KPIs To Consider for Your eCommerce Store
Here is the list of the best eCommerce KPIs to track and analyze your eCommerce store.
1. Conversion Rate

The conversion rate tracks the percentage of website visitors who complete a desired action. It includes click-through rates on social media, click-throughs on search engines, and more.
Besides this, the conversion rate also includes tracking various things on the website, such as the total number of people who subscribe to a newsletter, make an account, buy a product, or sign up for your exclusive program.

To calculate this, you need to divide total conversions (purchases) by the total website visitors and multiply by 100.
A high conversion rate indicates that more website visitors are taking the desired action. However, a low conversion rate often signals poor eCommerce user experience, whether in design, navigation, or checkout flow.
2. Average Order Value (AOV)
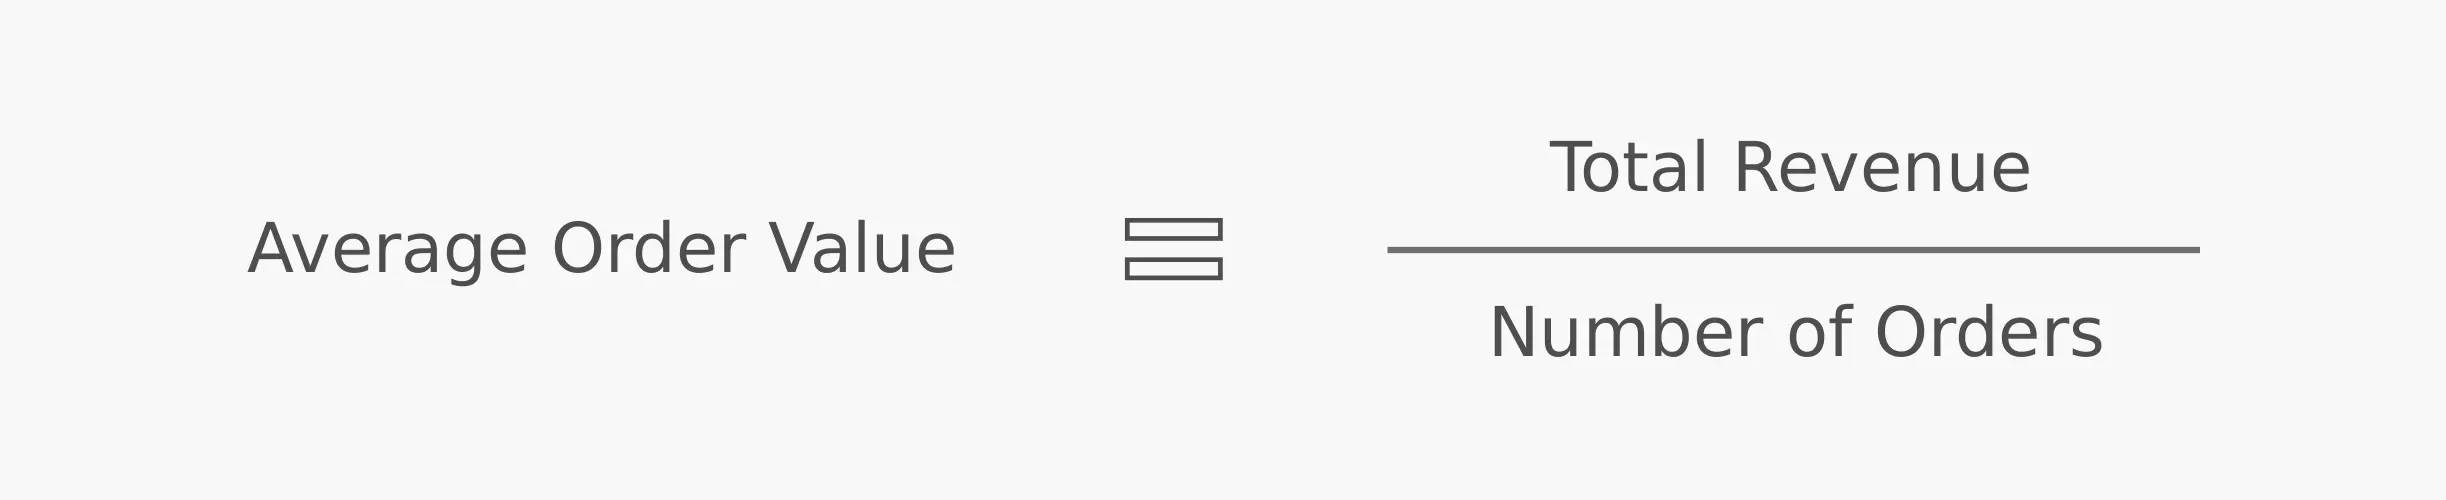
Average Order Value (AOV) measures the average amount of money a customer spends in one transaction.
It would be best if you tracked this KPI to understand total spending on customer acquisition and understand the behavioral patterns of customers.
To calculate AOV, divide the total revenue produced by the total orders. A higher AOV indicates that customers are spending more per transaction, which can lead to increased revenue and profitability.
You can improve the AOV by using proven strategies like product bundles, cross-selling, and loyalty programs—key tactics to increase eCommerce sales.
3. Shopping Cart Abandonment Rate
Cart abandonment rate is an eCommerce KPI that measures the percentage of customers who add items to their online shopping cart but leave the website without completing the purchase.
Think of a situation: you have invested massive time & effort in making a smooth checkout process by offering various payment options, deals, and whatnot, but customers leave the cart. This thing is common in eCommerce stores.
According to research by Bayward Institute, 70.22% is the average cart abandonment rate of most eCommerce stores worldwide.
To calculate the cart abandonment rate, divide the number of completed purchases by the number of shopping carts created, subtract the result from one & multiply the result by 100.

A high cart abandonment rate indicates various issues, such as high shipping costs, complicated checkout processes, lack of payment options, or trust issues—common eCommerce mistakes that can hurt conversions.
You can reduce the cart abandonment rate by simplifying the checkout process, offering a guest checkout option, providing free shipping, offering discounts, and optimizing the website for mobile devices.
4. Customer Lifetime Value (CLV)
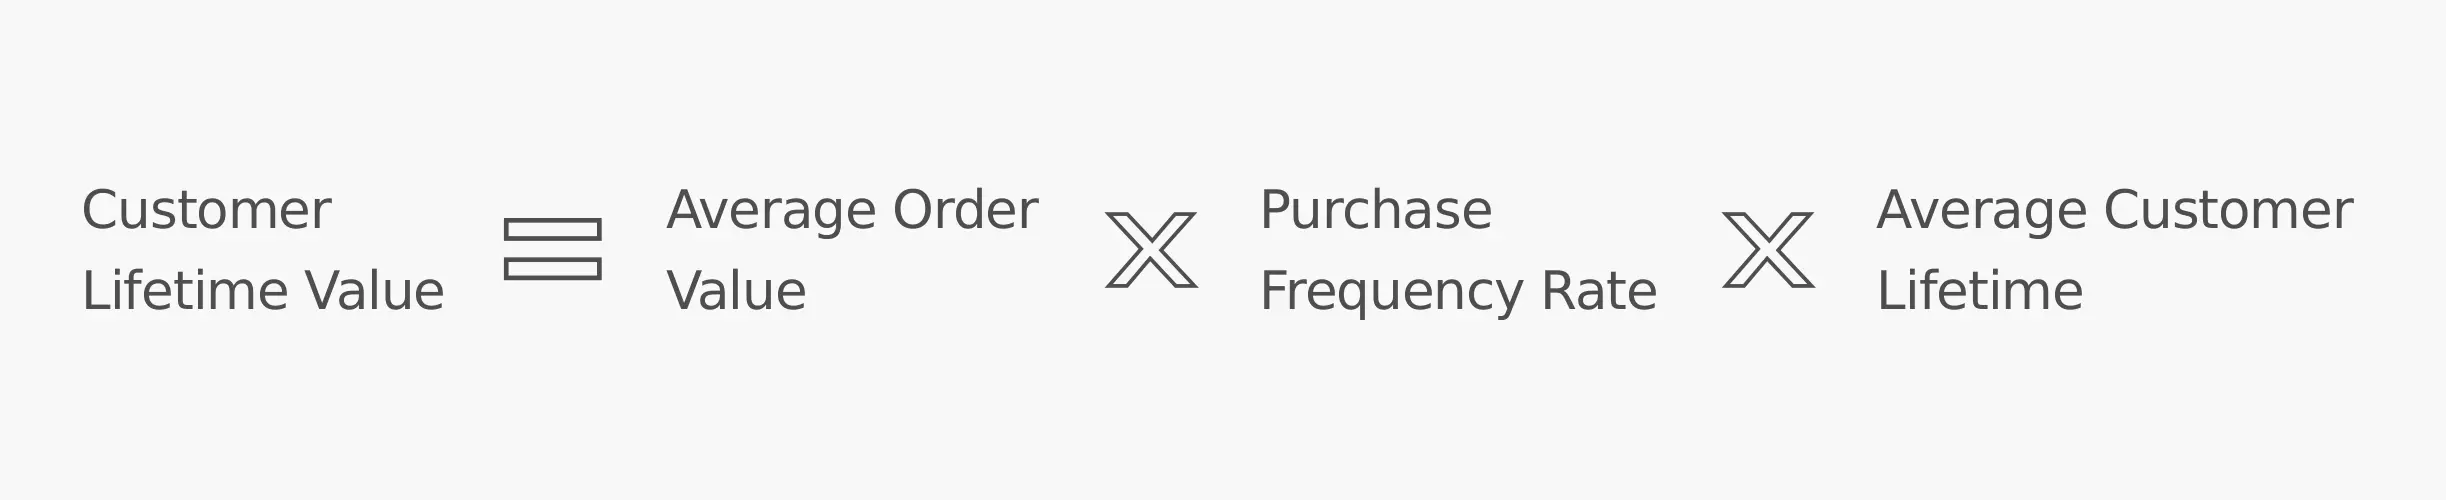
Customer Lifetime Value (CLV) is the total amount of money a customer is anticipated to spend on an eCommerce store during their entire lifetime.
To calculate CLV, multiply the average purchase value by the number of repeat transactions and the average customer lifespan. For instance, if a customer spends $200 per year for 5 years, the CLV will be $1000.
A higher CLV indicates that customers are more loyal and tend to spend more money, which can lead to increased revenue and profitability.
If your CLV is low, your purpose should be to increase it every year for as many customers as you can.
You can improve the CLV by offering excellent customer service, running marketing campaigns with personalized experience and loyalty programs, and providing highly-effective products that meet customers’ needs & expectations.
5. Customer Retention Rate
Customer Retention Rate (CRR) is one of the essential eCommerce KPIs that measure the total percentage of customers who make a repeat purchase from your eCommerce store within a specific time.
It is calculated by dividing the number of repeat customers by the total number of customers and multiplying by 100. Here, you can determine the repeat customers by subtracting the total number of new customers during that time from the number of customers at a specific time.

A high CRR indicates that you are successfully retaining customers & generating recurring revenue. Customer retention is crucial (and cost-effective), especially when supported by an eCommerce CRM integration to streamline customer relationships.
Therefore, improving CRR can increase a business’s profitability and reduce customer acquisition costs.

Struggling with tracking and optimizing your eCommerce KPIs?
WebDesk Solution can help! Contact us today and get an audit of your website.
Contact Us Now6. Net Promoter Score (NPS)
Net Promoter Score (NPS) is a customer satisfaction metric used in eCommerce that measures how likely customers are to recommend a business to others. If you treat your customers well, they will refer your eCommerce store to a friend. If not, they will share it with the entire world.
Customers are asked to rate on a scale of 0 to 10 how likely they are to recommend an eCommerce store, with 0 being not at all likely and 10 being extremely likely.
To calculate the NPS, you need to subtract the percentage of detractors (customers who rate 0-6) from the percentage of promoters (customers who rate 9-10). The result can range from -100 to 100.
NPS = Percentage of Promoters – Percentage of Detractors
A high NPS indicates your online store has great customer loyalty and advocacy, which can drive growth and revenue.
7. Customer Satisfaction Score (CSAT)

Customer Satisfaction Score (CSAT) is a popular eCommerce KPI that lets you measure how satisfied your customers are with your eCommerce store.
Customers are typically asked to rate their satisfaction on a scale of 1 to 5 or 1 to 10, with higher scores indicating higher satisfaction.
To calculate the CSAT score, you need to divide the sum of all the scores by the total number of respondents.
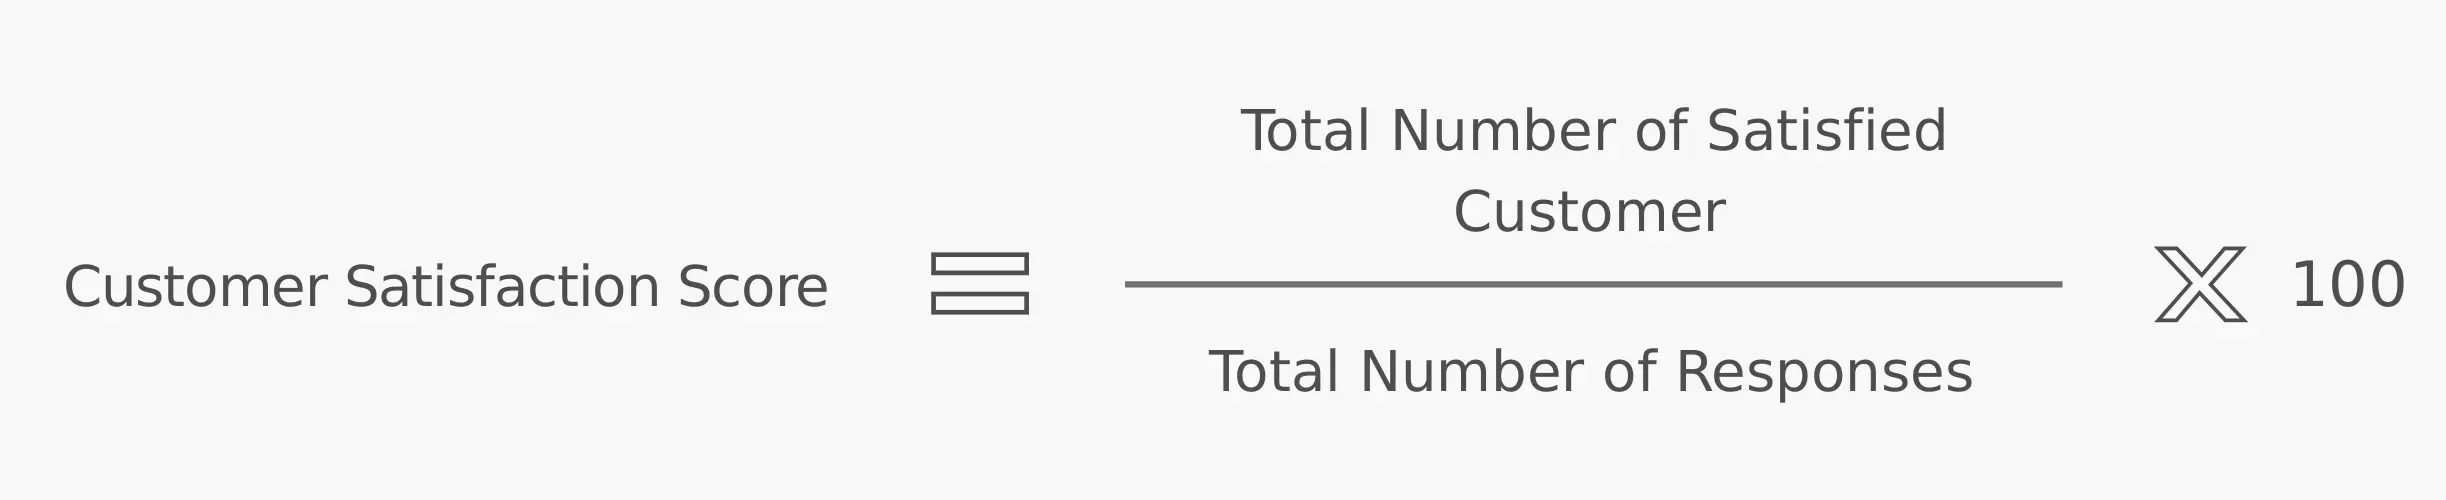
CSAT is an essential metric for assessing the overall satisfaction of customers and identifying areas for improvement. By improving CSAT, you can enhance customer loyalty and retention, reduce churn rates, and finally drive revenue growth.
8. Customer Acquisition Cost (CAC)
Customer Acquisition Cost (CAC) is a KPI that measures how much an eCommerce business spends on average to acquire a new customer.
To calculate the CAC, divide the total amount spent on sales and marketing activities over a specific time by the number of new customers acquired during that same period.
For instance, if a company spends $10,000 on sales & marketing for a specific month and acquires 1000 customers in that month, then the customer acquisition cost is calculated as:
CAC = Total amount spent on sales & marketing / Total number of customers acquired
CAC = $10,000/1000
CAC = $10
It indicates that the company has spent an average of $10 to acquire each new customer in that particular month.

CAC is a crucial KPI as it helps to become familiar with the cost-effectiveness of their marketing and sales strategies. By lowering CAC, you can increase the profitability and growth of your online store and make the right decisions about resource allocation & customer acquisition efforts.
9. Net Profit
It is one of the most crucial eCommerce KPIs to determine the profitability of any eCommerce business after deducting all expenses from the total revenue.
To calculate the Net Profit, you need to subtract all the expenses (including the cost of goods sold, operation costs, taxes, etc.) from the total revenue earned during a given period.

Net Profit is an essential metric for your eCommerce store as it provides an overall scenario of the financial health of a business. A positive net profit indicates that you are going in the right direction, while a negative net profit indicates that your online store is running at a loss. Ultimately, your goal should be maximizing Net Profit for your eCommerce store’s long-term success and sustainability.
10. Return on Investment
Return on Investment (ROI) lets you track the profitability of an investment relative to its cost. In simple words, ROI provides insights into how your investment has helped to increase business by considering earnings and expenses.
ROI is calculated by dividing the net profit gained from an investment by the cost of that investment and multiplying the result by 100 to express it as a percentage.

A high ROI indicates that your investment has generated a significant return relative to its cost, while a low ROI denotes that your investment was not worth it.
ROI is a crucial metric for your store as it lets you make informed investment decisions and prioritize the most profitable opportunities.
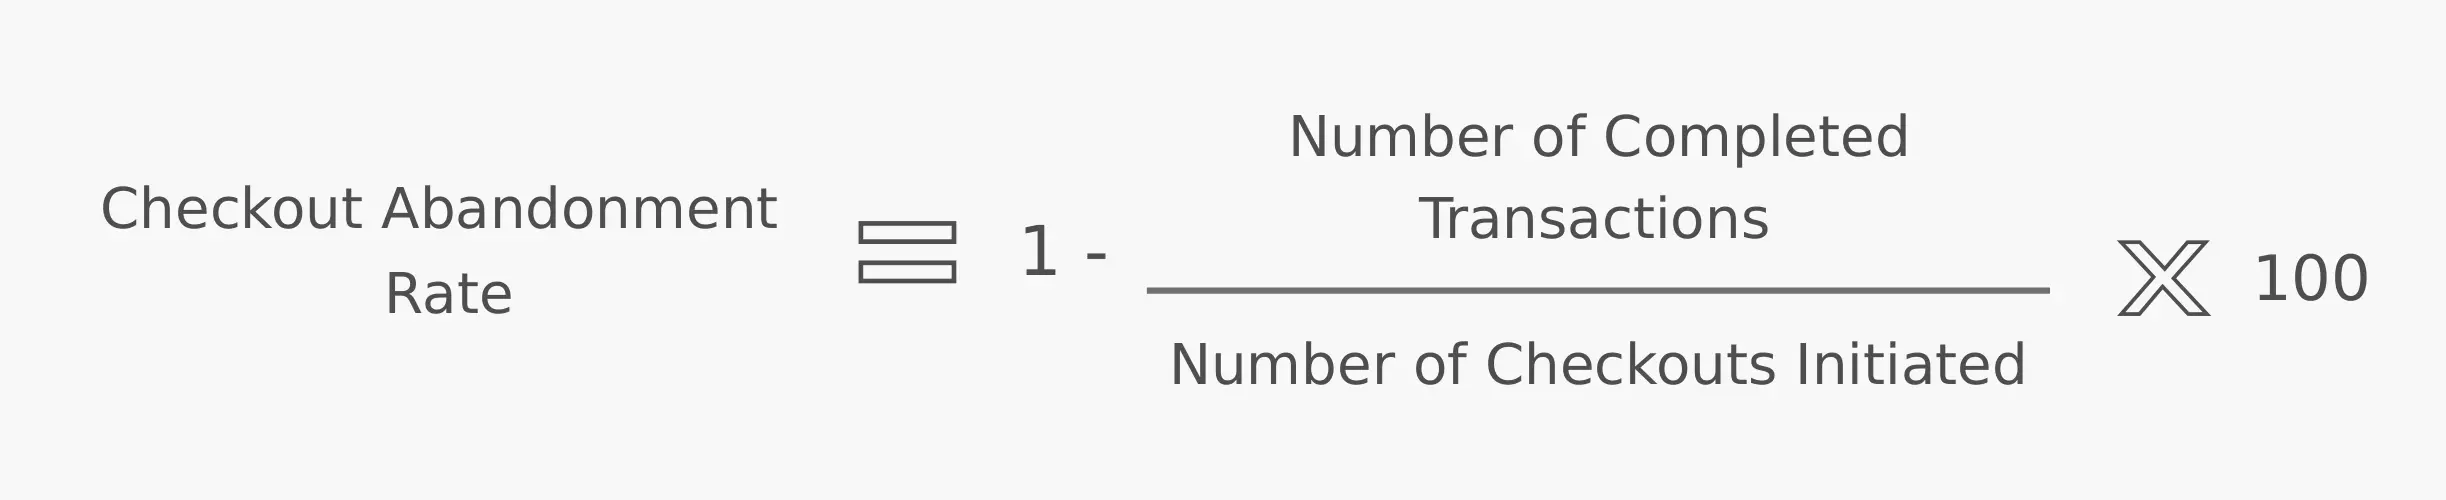
11. Checkout Abandonment Rate
After selecting products and moving to the checkout page, checkout abandonment occurs when potential customers opt not to make a purchase.
This happens when customers close the eCommerce platform after entering their personal details and payment information, resulting in an incomplete transaction. Implementing eCommerce checkout page best practices can help minimize friction at this critical stage and reduce the likelihood of drop-offs.
Understanding and addressing the reasons behind checkout abandonment is crucial for eCommerce businesses to improve conversion rates and maximize sales opportunities.
12. Average Session Length
Average Session Duration (ASD) is an essential web analytics metric that measures how long users spend visiting and browsing a website during any one visit or session.
User engagement and content relevance can be gauged using long sessions; more meaningful interactions will typically indicate deeper involvement from users.
An increasing Average Session Duration indicates that visitors find your website engaging and beneficial; conversely, an unexpected drop could signal content or user experience issues that need improvement.

Monitoring this metric provides website owners a means of measuring the success of their online presence and making sound decisions to increase user engagement.
13. Customer Engagement
Engagement refers to the level of interaction and participation your customers have with your brand.
Consumer experience goes beyond mere transactions; it includes active interactions, feedback, and loyalty.
Effective engagement strategies focus on cultivating strong relationships that create trust and foster an atmosphere of belonging within communities.

Customer engagement leads to brand advocacy and long-term business success.
14. Churn Rate
Churn is an invaluable metric for businesses, providing insight into how quickly customers disconnect or stop buying from an individual or brand.
Attrition rates reflect the quality of customer relationships.
An elevated customer turnover rate indicates potential revenue losses and indicates the need to use retention strategies; conversely, low customer churn rates indicate strong customer relationships.

Monitoring and managing churn rates are vital elements in maintaining business growth and profit.
15. Order Accuracy
Order accuracy, an essential e-commerce metric, refers to the proportion of orders that were flawlessly processed and delivered without errors such as mismatched items or wrong quantities.
Order accuracy has a direct bearing on customer satisfaction. Accurately processed orders ensure customers get what they expect. This builds trust among frequent buyers while simultaneously creating repeat business.
Thus, achieving high order accuracy levels is vitally important if businesses wish to provide exceptional service while retaining loyal clients.

Conclusion
In the end, tracking key performance indicators is crucial for the success of an eCommerce business. By tracking and analyzing KPIs, you can make better decisions for your store, enhance business operations, and generate more profit.
If you still have any doubts regarding the eCommerce KPIs, feel free to contact us.
WebDesk Solution is a leading eCommerce development company. We have been providing best-in-class eCommerce solutions for web and mobile. Hence, we can understand the needs of your business well and provide the best eCommerce solution.